Interstate High Speed Rail Rationale
America’s population and urbanization have outgrown highways and airports. When we widen highways a few years later traffic congestion returns. Our Top 20 airports are getting more congested which also increases smog and contributes to Global Warming.
U.S. Population & Urbanization Growing Faster Than Highway Capacity
Like all Big Infrastructure, an Interstate High-Speed Rail is very expensive to build. Since public dollars will build most of it, the Interstate High-Speed Rail Rationale for Benefits over Costs must also be big.
The “Golden Era of Highway Driving” which began around 1950, ended shortly after the second OPEC Oil Embargo in 1979. In that golden era, cars and gasoline were cheap. New highways opened every month. The Federal Gasoline Tax covered highway maintenance. Highway capacities typically limited “Rush Hour” to only 30-45 minutes in the morning and evening.
Americans bragged about driving 75 mph on urban highways and 85 mph on rural highways. They don’t brag about those speeds as often today.
Population is growing faster than highway capacity. Pre-COVID highway congestion was also worse because America grew from 64% urbanized in 1950 to 82% urbanized by 2019-end. When you look at the U.S. Census Bureau data, population & urbanization forecasts, and pre-COVID rates of automobile purchases, things will get worse if our society doesn’t build more Rapid Transit for short-distance commutes and High-Speed Rail (HSR) for regional distances in many corridors.
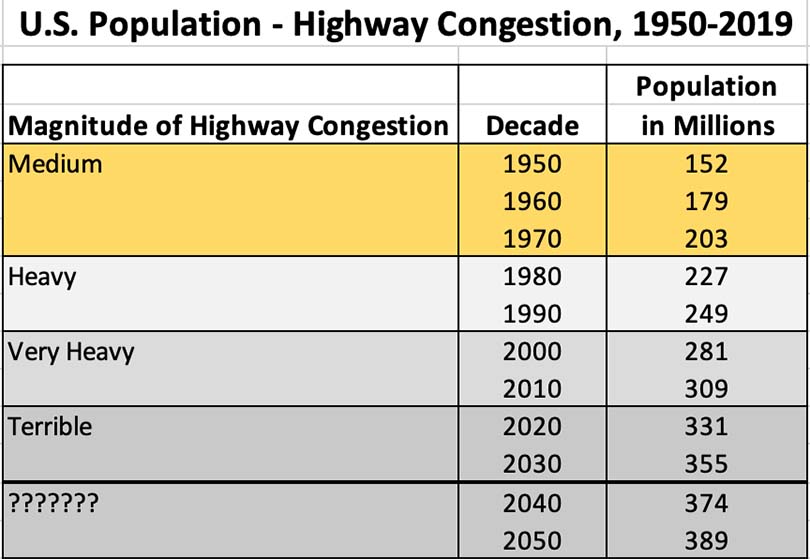
U.S. Population to Highway Congestion; source Soul Of America
Most travel originates & ends inside regions that generate the greatest economic activity which economists call “Gross Domestic Product (GDP).” Highway and Airport congestion in the high-activity corridors of mega-regions reduces productivity. That in turn, lowers GDP and reduces job potential.
By 2050, our Top 70 Metro Areas will have a 1+ million population. They increase the density of 25-to-600-mile corridors in what demographers call “Mega-regions”, as color-coded on the America 2050 Map below.
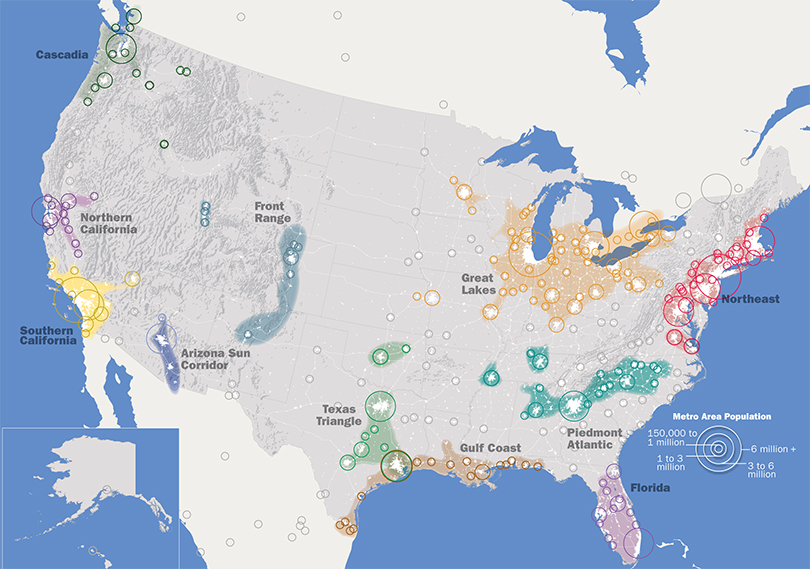
America 2050 Mega-Regions Map; source Regional Plan Association
America must dramatically increase its mobility capacity within and between metro areas in the corridors of mega-regions to prevent further loss of transportation-related productivity and reduce Greenhouse Gases (GHG) and Smog emissions.
Air Pollution, Persistent Health Problem Due To Transportation Emissions
While increasing our Transportation productivity, we must lower Transportation air emissions.
Nitrous oxide, air particulates, sulfur dioxide, volatile organic compounds, and hydrocarbons concentrate to form Smog above metro areas. Thanks to the Clean Air Act of 1970, fewer industries emit air particulates, volatile organic compounds, sulfur dioxide, and nitrous oxide. Thanks to federal regulation in 1975, gasoline-powered autos have catalytic converters that reduce nitrous oxide, hydrocarbons, and carbon monoxide emissions.
Most people don’t know, however, that smog levels remain unhealthy. Nor are many aware that catalytic converters do not trap greenhouse gases (GHG). Consequently, the Transportation and Energy sectors remain America’s largest contributors to Smog and GHG due to:
• Population growth
• More people buying oil-powered cars & small trucks
• Widening more Highways each year, faster than we build Rapid Transit, Regional Rail & HSR
• Development sprawl outside urbanized areas forces longer drives
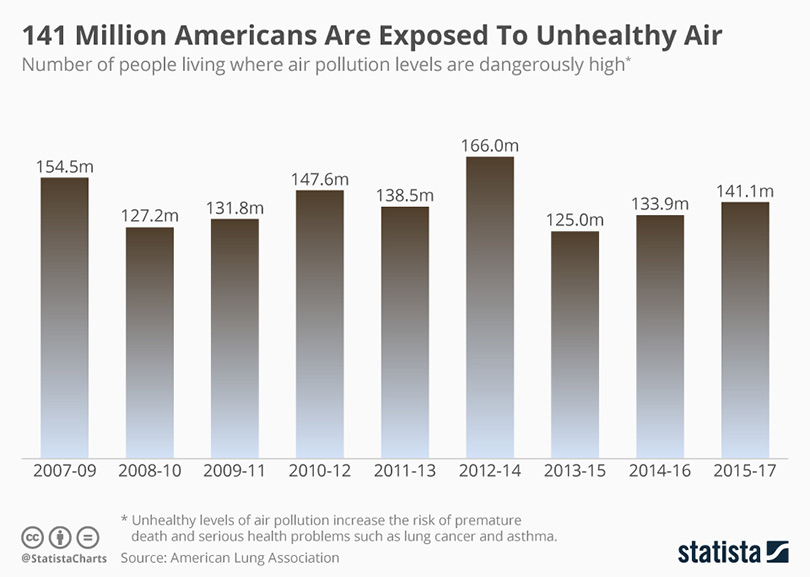
The EPA estimated that 125 million Americans live in areas of Non-Attainment for National Ambient Air Quality Standards. Moreover, persistent air pollution from oil-burning transportation is linked to chronic lung disease and therefore, rising health care costs. Most city-dwellers passively accept Stay Indoor Alerts as a way of life, rather than a societal choice.
In 2020, the American Lung Association ranked metro areas for ozone pollution. This problem is a nightmare for California, Las Vegas, and Phoenix, which dominate the Top 25 Metro Areas for air pollutants. That’s because warm dry climates surrounded by mountains trap air particulates, sulfur dioxide, and volatile organic compounds that produce smog.
Another insight is NYC Metro Area has 25 times the population of the Bakersfield Metro Area, yet lower Smog due to having one of the world’s largest electric Rapid Transit and Passenger Rail networks.
Jet fuel contains a high percentage of oil burned to generate energy, but emits nitrous oxide, carbon dioxide, and air particulates. From 1980-2008, airline deregulation doubled regional (sub-500 mile) flights, while maintaining growth for longer flights. Regional flights became the biggest cause of traffic congestion and air pollutants surrounding our commercial airports.
Over-Dependence on Risky Oil & Risky Natural Gas
In 2011, 33 of the 48 largest oil-producing nations hit Peak Oil Conditions. Many economists call this easy-to-access fossil fuel, “Cheap Oil.” Peak Oil Theory was correct in predicting that oil several hundred feet from the surface is declining.
In 2020, America had only 5% of the world’s population, yet consumed 20% of world oil production.
In the last two decades, oil & natural gas companies pioneered technology to drill thousands of feet underwater and underground, then use a horizontal process to break tightly packed shale that unleashes oil & natural gas. The process is called “Fracking.” The industry calls the resulting oil and natural gas “Tight Oil” and “Tight Natural Gas”, respectively. That industry employs so many people in domestic oil & natural gas production, most Americans go along to get along.
The U.S. Energy Information Administration (EIA) reported that America’s Tight Oil & Gas production soared to 96% of what we consume. If the trend continues post-pandemic, EIA estimates America can become oil self-sufficient around 2030.
Will the oil boom last until 2040 and is that good news? Answering the first part, Maybe. Answering the second part, only in the short term because it buys us time to build up green Sustainable Energies.
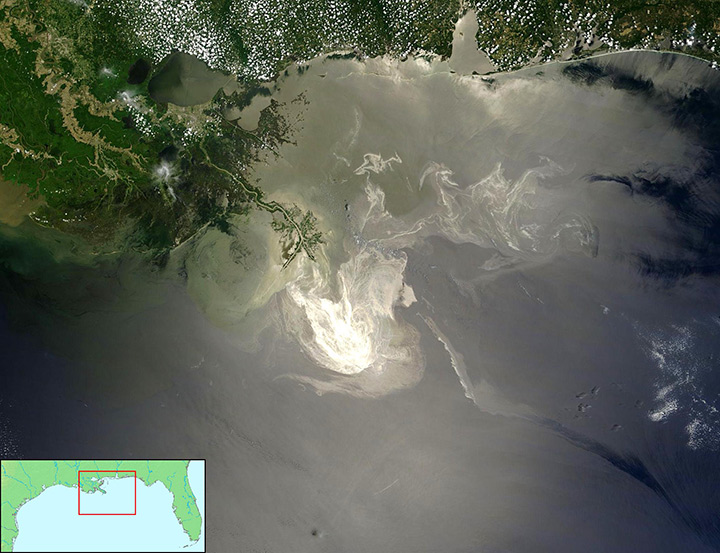
Small oil spills happen all the time. But as the NASA image above reveals for the BP Gulf of Mexico spill in May 2010, the pursuit of Tight Oil in deepwater has catastrophic risks compared to Cheap Oil close to the surface. Imagine a similar catastrophe polluting water aquifers deep underground.
Minimizing the probability of catastrophic spills requires expensive technology, rigorous safety inspections, and luck. That is why it is more accurate to call Tight Oil & Tight Natural Gas, “Risky Oil & Risky Natural Gas.”
Global Population Rising, GHG Emissions, and Deforestation
World population is forecast to grow from 7 billion in 2012 to 9 billion by 2043. Though populations are stabilizing in the European Union, Russia, Japan, and China, huge population growth in India, Indonesia, Malaysia, Thailand, Brazil, Pakistan, Nigeria, and Mexico are driving their economies to demand more fossil fuels, wood, and plastics.
The global consequences of rising demand for coal, oil & natural gas are profound because their extraction processes and burning emit GHG and smog (Ozone & particulates). Based on their volume and impact, scientists categorize carbon dioxide (CO2), methane (CH4), and nitrous oxide (N2O) as the most dangerous set of GHG.
Wood deforestation is also a matter of grave concern. Excessive deforestation for commercial wood in Brazil, Central Africa, and Southeast Asia is reducing the world’s ability to absorb CO2 emissions before they reach the upper atmosphere.
Freight trucks, cargo ships, and cruise ships burn diesel fuel that emits substantial Carbon Dioxide and Nitrous Oxide around seaports. U.S. Energy Information Administration (EIA) estimates that diesel fuel consumption emitted 24% of U.S. Transportation sector CO2 emissions, nearly equal to 9% of total energy-related CO2 emissions in 2019.
Airplanes burn oil-based jet fuel that emits Carbon Dioxide and Nitrous Oxide around airports and, high in the atmosphere where it’s most dangerous at trapping heat. The World Resources Institute provides this equally insightful chart of CO2 Emissions by Nation:
Though Freight Trucks, Cargo Ships, Cruise Ships, and Airplanes are employing more battery technology to lower air emissions, those modes of transportation are unlikely to become electric-powered before 2075. Consequently, those industries must quicken their pace to greener Sustainable Fuels, more energy-efficient engineering designs, and best operational practices that further lower air emissions.
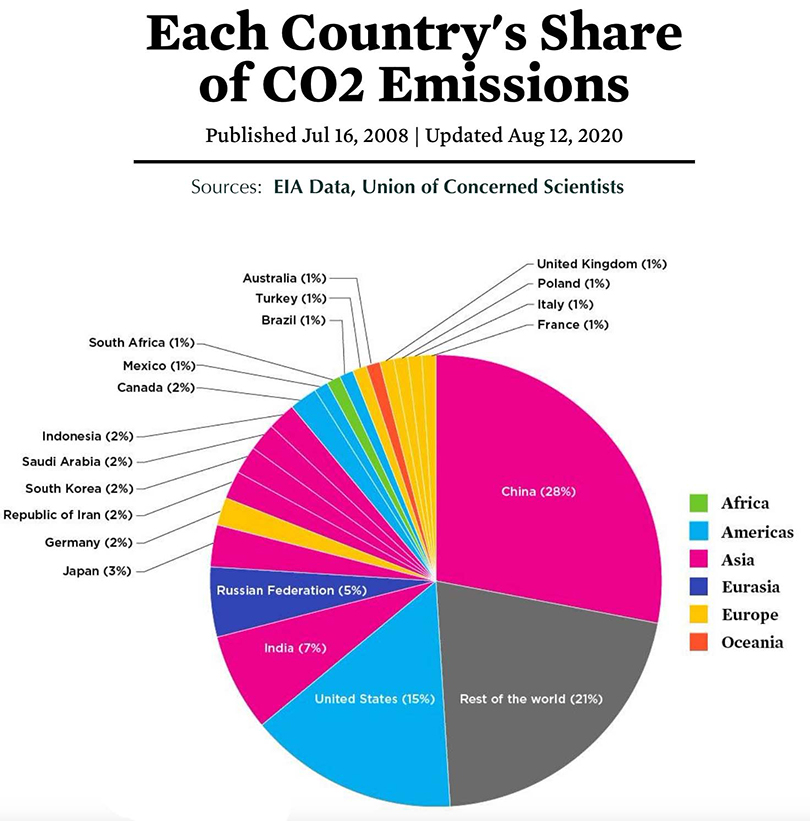
CO2 Emissions by Country 2020; source Union of Concerned Scientists
Every nation on the chart above must enact policies and incentives that lower GHG emissions and lessen deforestation. If not, the fallout from Global Warming will make the Russian war on Ukraine look like a kindergarten prank.
Global Warming Effects Have Arrived
Global warming is negatively impacting our world. Mostly man-created, GHG emissions have driven the surface temperature of the Earth to 3 degrees Fahrenheit higher than in 1900. Higher air & water temperatures have doubled the speed of permafrost and glacier melt.
As many countries and states have discovered since 2005, droughts, forest fires, and larger hurricanes thrive on higher temperatures.
Even worse, the EPA forecasted global temperature to rise 4-6 degrees Centigrade (8-12 degrees Fahrenheit) by 2100 if we don’t drastically cut GHG emissions now.
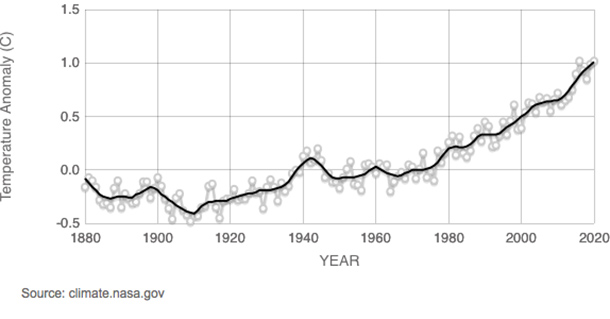
Global Centigrade Temperature rise, 1880-2020; credit NASA
Methane, the primary component of natural gas, is emitted during coal, oil, natural gas & other deep mining, when not burned completely, and when natural gas refineries vent & flare. Methane gas has a shorter atmospheric lifetime than Carbon Dioxide — 12 years compared with centuries. But while it exists, Methane is 20 times more powerful than Carbon Dioxide at trapping heat in the atmosphere.
It is technologically feasible to cut 75% of Methane emissions from natural gas operations, but stronger federal regulations are needed. That is easier for other nations to do, where national policy is stronger in those matters.
In contrast, the U.S. has natural gas permitting and venting restrictions executed at the state level. Without federal restrictions, a state like Texas emits far more Methane per capita than higher population California.
Nitrous Oxide is another prominent emission from burning coal and jet fuel. Nitrous oxide is 310 times more powerful than carbon dioxide at trapping heat. Jets emit it high in the atmosphere, making it particularly dangerous. The EPA says that globally, 40% of nitrous oxide emissions come from flights and the other large chunk comes from coal burning.
To prevent widespread calamity by 2050, 99% of climatologists say we must dramatically cut GHG emissions to limit global temperature rise to 1.5 degrees Celcius. It’s good that America’s Coal consumption is rapidly declining. Still, we must set stronger global examples for Carbon Dioxide, Methane, and Nitrous Oxide reductions in our 3 largest GHG-emitting sectors — Transportation, Energy, and Industry.
Since the 1960s, research scientists in the federal government have warned coal, oil & gas companies about the dangers of fossil fuels. In the 1970s-80s, coal, oil & gas company research scientists gave them the same warning. But don’t expect any major changes or accountability from oil & natural gas companies. As long as record profits roll in, they will continue “Green-washing” TV commercials to fool the public.
Does America have Transportation alternatives to reduce Highway Congestion, Smog & GHG? See Part 4 for insights for important compliments to Interstate High-Speed Rail Rationale.